
Housing affordability on a year-over-year basis declined in March for the first time since January 2019, ending a more than two-year streak of rising affordability. The long run of increasing affordability snapped, even as two of the three key drivers of the Real House Price Index (RHPI), household income and mortgage rates, swung in favor of greater affordability relative to one year ago.
Lower mortgage rates and higher household income compared with one year ago propelled an 11 percent increase in house-buying power. However, surging house-buying power drives demand, and rising demand in a supply-constrained market accelerates nominal house price appreciation. In March, the final component of the RHPI, nominal house prices, appreciated at its fastest annual pace since 2005, 14.8 percent, wiping out any affordability boost from rising house-buying power. Yet, real estate is local and since house-buying power and nominal house price gains vary by city, local affordability trends may differ greatly city by city as well.
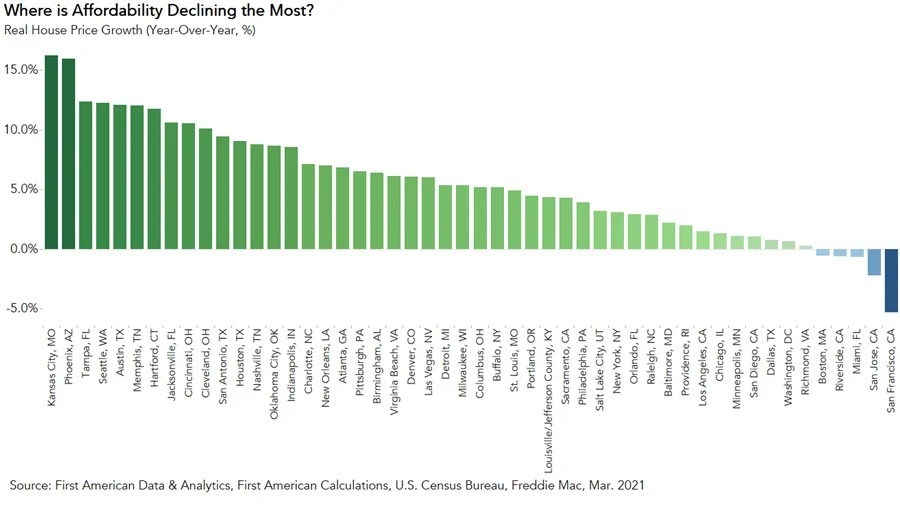
Affordability Declined in 45 of 50 Major Markets
The drop in affordability was broadly felt as affordability declined year over year in 45 of the 50 markets we track. The five markets with the greatest year-over-year decline in affordability were:
- Kansas City, Mo.
- Phoenix
- Tampa, Fla.
- Seattle
- Austin, Texas
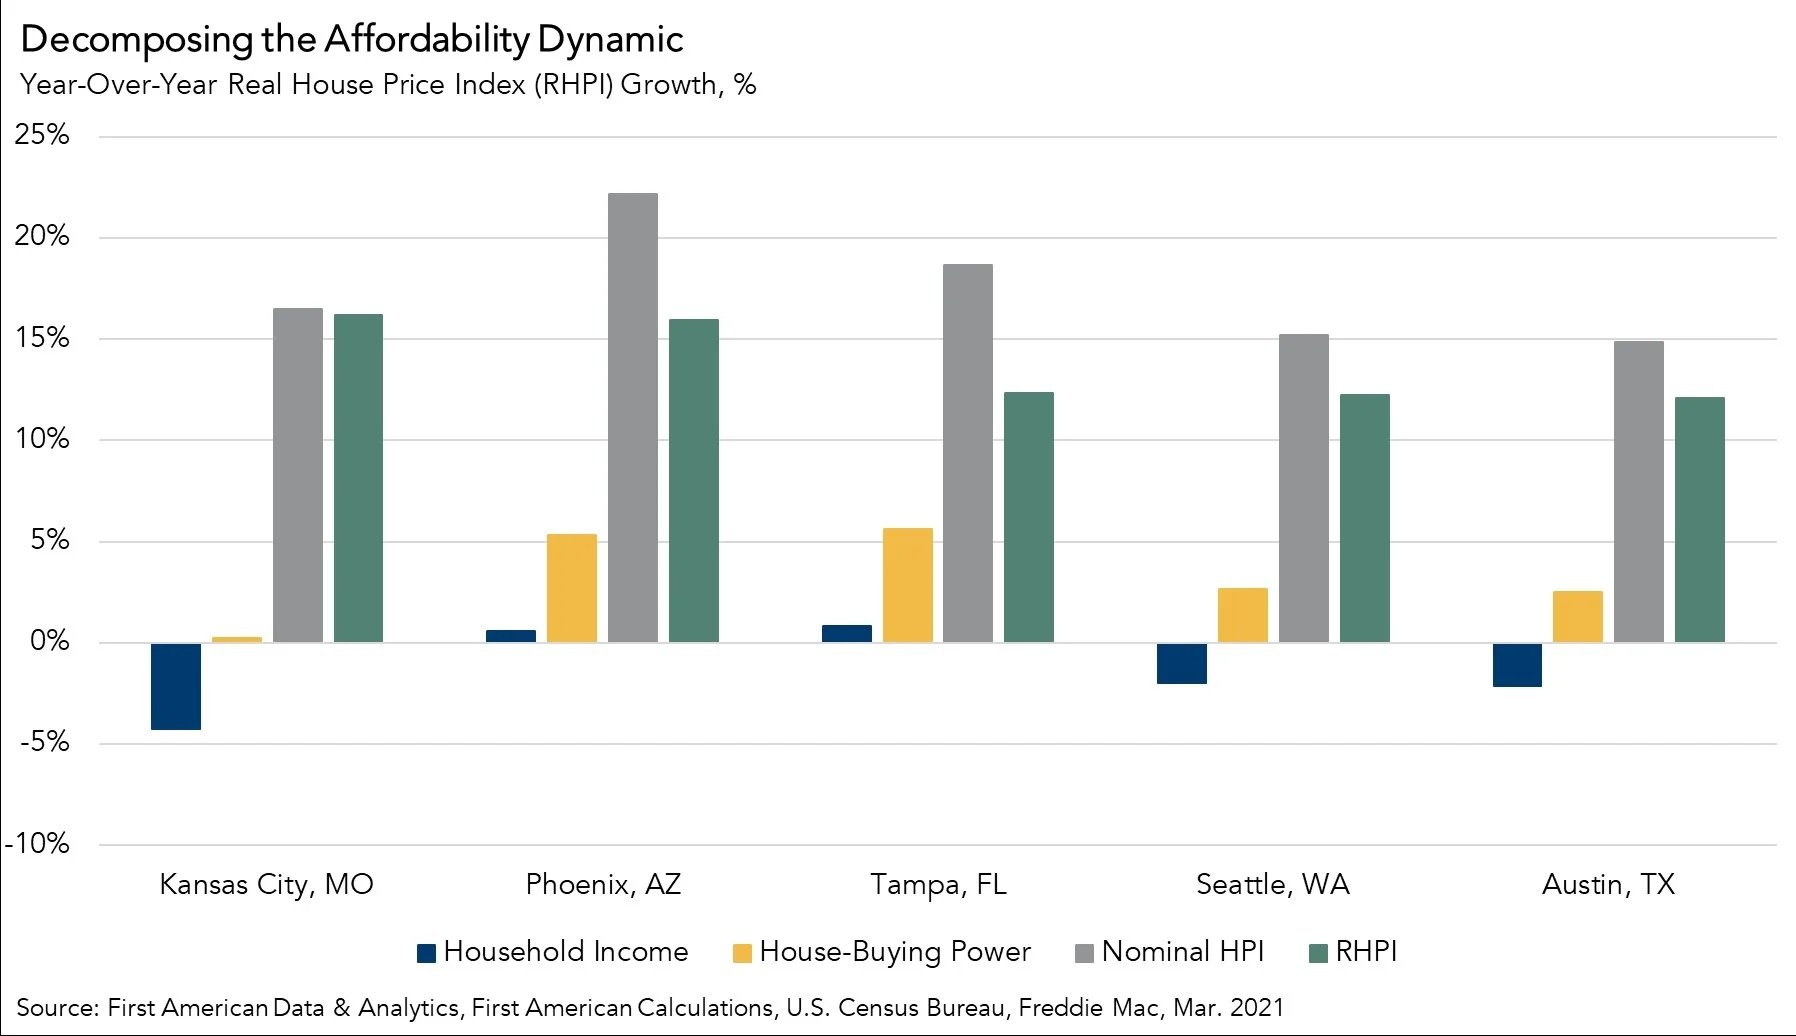
Falling mortgage rates boost affordability equally in each market as mortgage rates are generally the same across the country. However, household income growth and nominal house prices vary by market, so the affordability dynamic varies as well. Faster nominal house price appreciation can erode, or even eliminate, any benefit in affordability from lower mortgage rates, especially if household income declines at the same time.
In March, Kansas City had the greatest year-over-year decrease in affordability, mostly due to the 4.3 percent annual decline in household income and a 16.5 percent increase in nominal house prices compared with a year ago. Phoenix and Tampa both had even faster nominal house price appreciation than Kansas City, but household incomes held steady in both markets, so the relative affordability loss was less than in Kansas City. Seattle and Austin faced both faster nominal house price growth and lower household income, fueling declines in affordability in both cities. In all of these markets, the takeaway is that nominal house price appreciation accelerated to a level that eliminated any affordability gains from strong house-buying power.
What is the Outlook for Affordability?
If house prices continue to escalate near their current pace, some prospective home buyers that are on the margin will pull back, prompting fewer or less intense bidding wars and causing house price appreciation to moderate, which may help affordability. As more and more people are vaccinated and the economic recovery continues, demand for labor is likely increase, and that can put upward pressure on wages as employers compete to attract employees. At the same time, mortgage rates edged down slightly in April and even dipped below 3 percent in May. House-buying power is likely to remain robust in the months to come, but affordability trends will likely hinge on changes in nominal house price appreciation.
For more analysis of affordability, please visit the Real House Price Index.
The RHPI is updated monthly with new data. Look for the next edition of the RHPI the week of June 28, 2021.
Sources:
March 2021 Real House Price Index Highlights
The First American Real House Price Index (RHPI) showed that in March 2021:
- Real house prices increased 4.2 percent between February 2021 and March 2021.
- Real house prices increased 3.5 percent between March 2020 and March 2021.
- Consumer house-buying power, how much one can buy based on changes in income and interest rates, declined 2.5 percent between February 2021 and March 2021, and increased 10.9 percent year over year.
- Median household income has increased 5.9 percent since March 2020 and 77.8 percent since January 2000.
- Real house prices are 21.6 percent less expensive than in January 2000.
- While unadjusted house prices are now 25.3 percent above the housing boom peak in 2006, real, house-buying power-adjusted house prices remain 44.9 percent below their 2006 housing boom peak.
March 2021 Real House Price State Highlights
- The five states with the greatest year-over-year increase in the RHPI are: Arizona (+13.9 percent), Vermont (+12.7 percent), Wyoming (+12.6 percent), Washington (+10.9 percent), and Mississippi (+9.8 percent).
- The only two states with a year-over-year decrease in the RHPI are: New York (-0.2 percent) and Illinois (-0.04 percent).
March 2021 Real House Price Local Market Highlights
- Among the Core Based Statistical Areas (CBSAs) tracked by First American, the five markets with the greatest year-over-year increase in the RHPI are: Kansas City, Mo. (+16.2 percent), Phoenix (+16.0 percent), Tampa, Fla. (+12.4 percent), Seattle (+12.2 percent), and Austin, Texas (+12.1 percent).
- Among the Core Based Statistical Areas (CBSAs) tracked by First American, the five markets with the greatest year-over-year decrease in the RHPI are: San Francisco (-5.3 percent), San Jose, Calif. (-2.2 percent), Miami (-0.7 percent), Riverside, Calif (-0.6 percent), and Boston (-0.6 percent).
About the First American Real House Price Index
The traditional perspective on house prices is fixated on the actual prices and the changes in those prices, which overlooks what matters to potential buyers - their purchasing power, or how much they can afford to buy. First American’s proprietary Real House Price Index (RHPI) adjusts prices for purchasing power by considering how income levels and interest rates influence the amount one can borrow.
The RHPI uses a weighted repeat-sales house price index that measures the price movements of single-family residential properties by time and across geographies, adjusted for the influence of income and interest rate changes on consumer house-buying power. The index is set to equal 100 in January 2000. Changing incomes and interest rates either increase or decrease consumer house-buying power. When incomes rise and mortgage rates fall, consumer house-buying power increases, acting as a deflator of increases in the house price level. For example, if the house price index increases by three percent, but the combination of rising incomes and falling mortgage rates increase consumer buying power over the same period by two percent, then the Real House Price index only increases by 1 percent. The Real House Price Index reflects changes in house prices, but also accounts for changes in consumer house-buying power.
To read more articles about the housing market, please subscribe to the Economic Center Blog.
Disclaimer
Opinions, estimates, forecasts and other views contained in this page are those of First American’s Chief Economist, do not necessarily represent the views of First American or its management, should not be construed as indicating First American’s business prospects or expected results, and are subject to change without notice. Although the First American Economics team attempts to provide reliable, useful information, it does not guarantee that the information is accurate, current or suitable for any particular purpose. © 2021 by First American. Information from this page may be used with proper attribution.
Related Newsletter Articles


Mark Fleming, Ph.D
Chief Economist
First American Financial Corporation